SmartMelt
Your GPS for Aluminum Melting Optimization
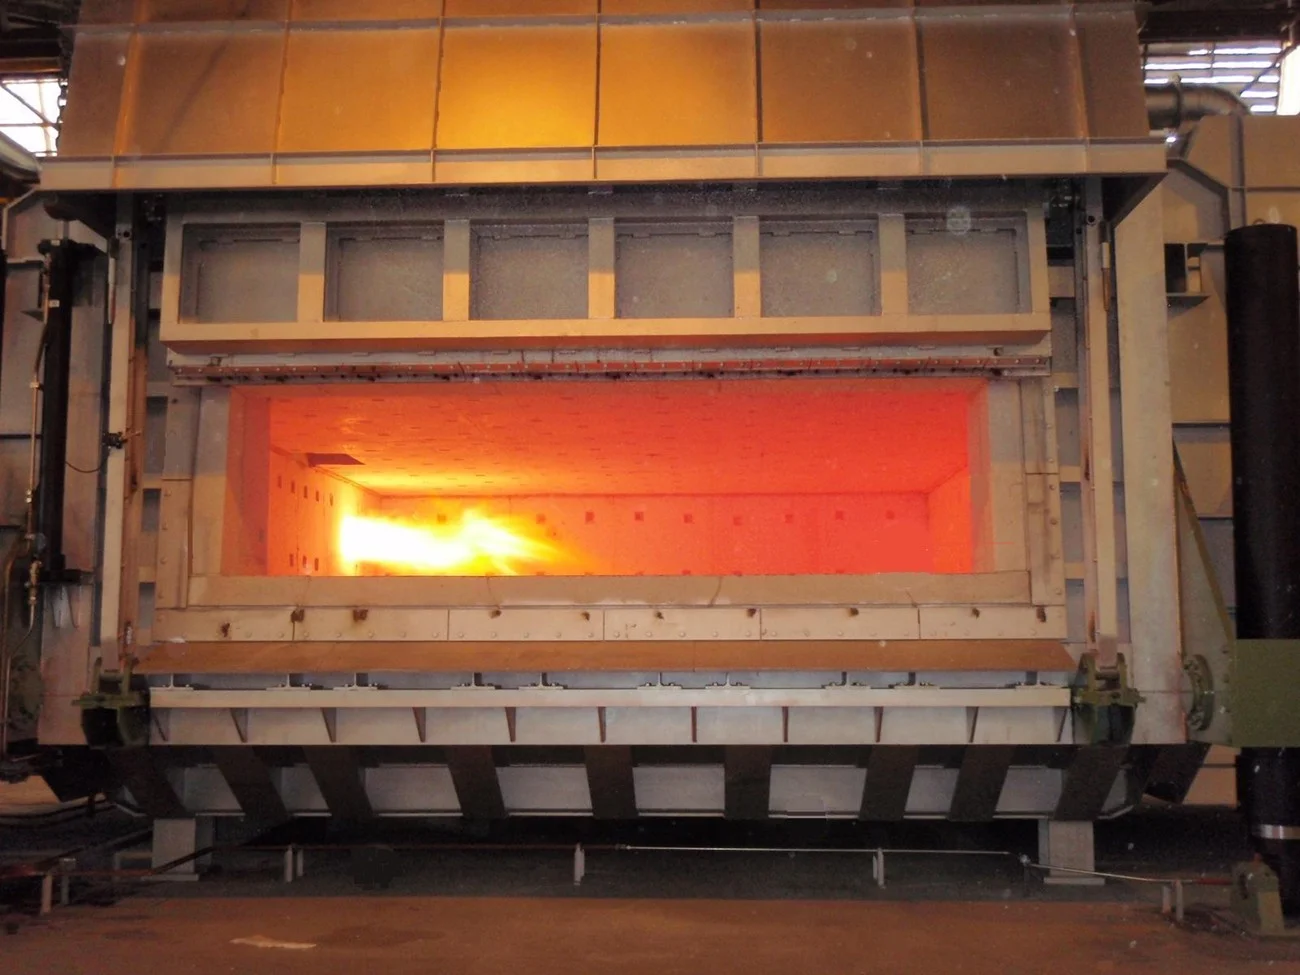
Aluminum melting furnaces consume 700–1,400 kWh per tonne — up to 4× the theoretical minimum. SmartMelt closes this gap with a digital twin of your specific furnace, guiding operators through every step of the melting cycle — from charging to tapping — so each decision is backed by real-time data, not guesswork.
Up to 10%
Avg. Efficiency Improvement
Up to 0.5M€
Avg. Annual Savings per Furnace
500,000+
Hours in Service
24–110t
Furnace Capacity Range
How It Works
Data Acquisition
SmartMelt integrates with your existing infrastructure through multiple communication protocols — OPC-UA, direct PLC connections (Siemens, Allen-Bradley, and others), SQL databases, or custom APIs — continuously collecting temperatures, gas flows, door states, and material conditions across furnaces from 24 to 110 tonnes. First furnace installation takes just 2 months; each additional furnace around 2 weeks.
Digital Twin Simulation
The collected data feeds into a digital twin — a virtual replica of your specific furnace — that predicts the full cycle in seconds, tracking key indicators: melting rate (T/h), gas consumption (Nm³/T), overall efficiency (%), and door energy loss (MWh).
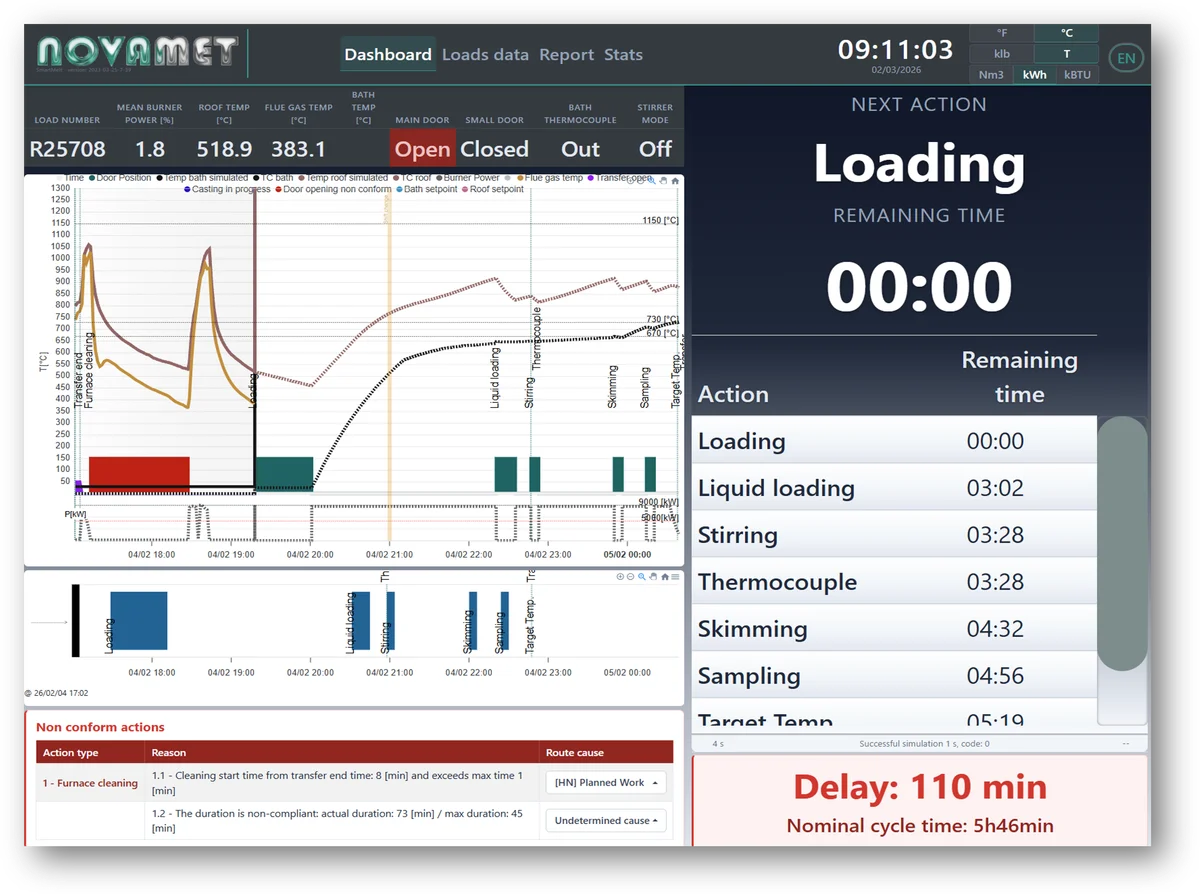
On-Line Comparison
Real furnace data is continuously compared against simulation results, identifying deviations and optimization opportunities as they happen — for example, detecting that a single unnecessary door opening can cause 5% energy loss.
Optimized Actions
SmartMelt recommends the next best action to the operator with clear, step-by-step guidance that requires under 1 hour of training. Simplified reporting makes results visible across the entire organization.
Key Features
Digital Twin Technology
A virtual replica of your specific furnace that combines efficient numerical calculations with real-time data acquisition, continuously tracking melting rate, gas consumption, overall efficiency, and energy losses throughout each cycle.
Data-Driven Optimization
Data from the furnace controller is analyzed and compared in real time to numerical simulation results, generating next-action recommendations — just as a GPS calculates the next turn based on current position and destination.
Energy Reduction
Close the gap between actual and theoretical energy consumption by optimizing every phase of the melting cycle — reducing waste heat, cutting fuel use, and lowering operational costs by up to 0.5 M€ annually.
Cycle Time Minimization
SmartMelt identifies the optimal timing for each process step, reducing variability between operators and shifts. Consistent cycles mean predictable output and fewer delays.
Operator Assistance
Intuitive real-time guidance that requires under 1 hour of training. Operators receive clear next-action recommendations, while management gets simplified reports for cross-organizational visibility.
Field-Proven Reliability
With 500,000+ hours of service across EU and US facilities since 2019, SmartMelt is proven on furnaces from 24 to 110 tonnes. First furnace installation takes 2 months; each additional furnace just 2 weeks.
Inside the Platform
Real screenshots from production deployments — see how SmartMelt turns raw furnace data into actionable intelligence.
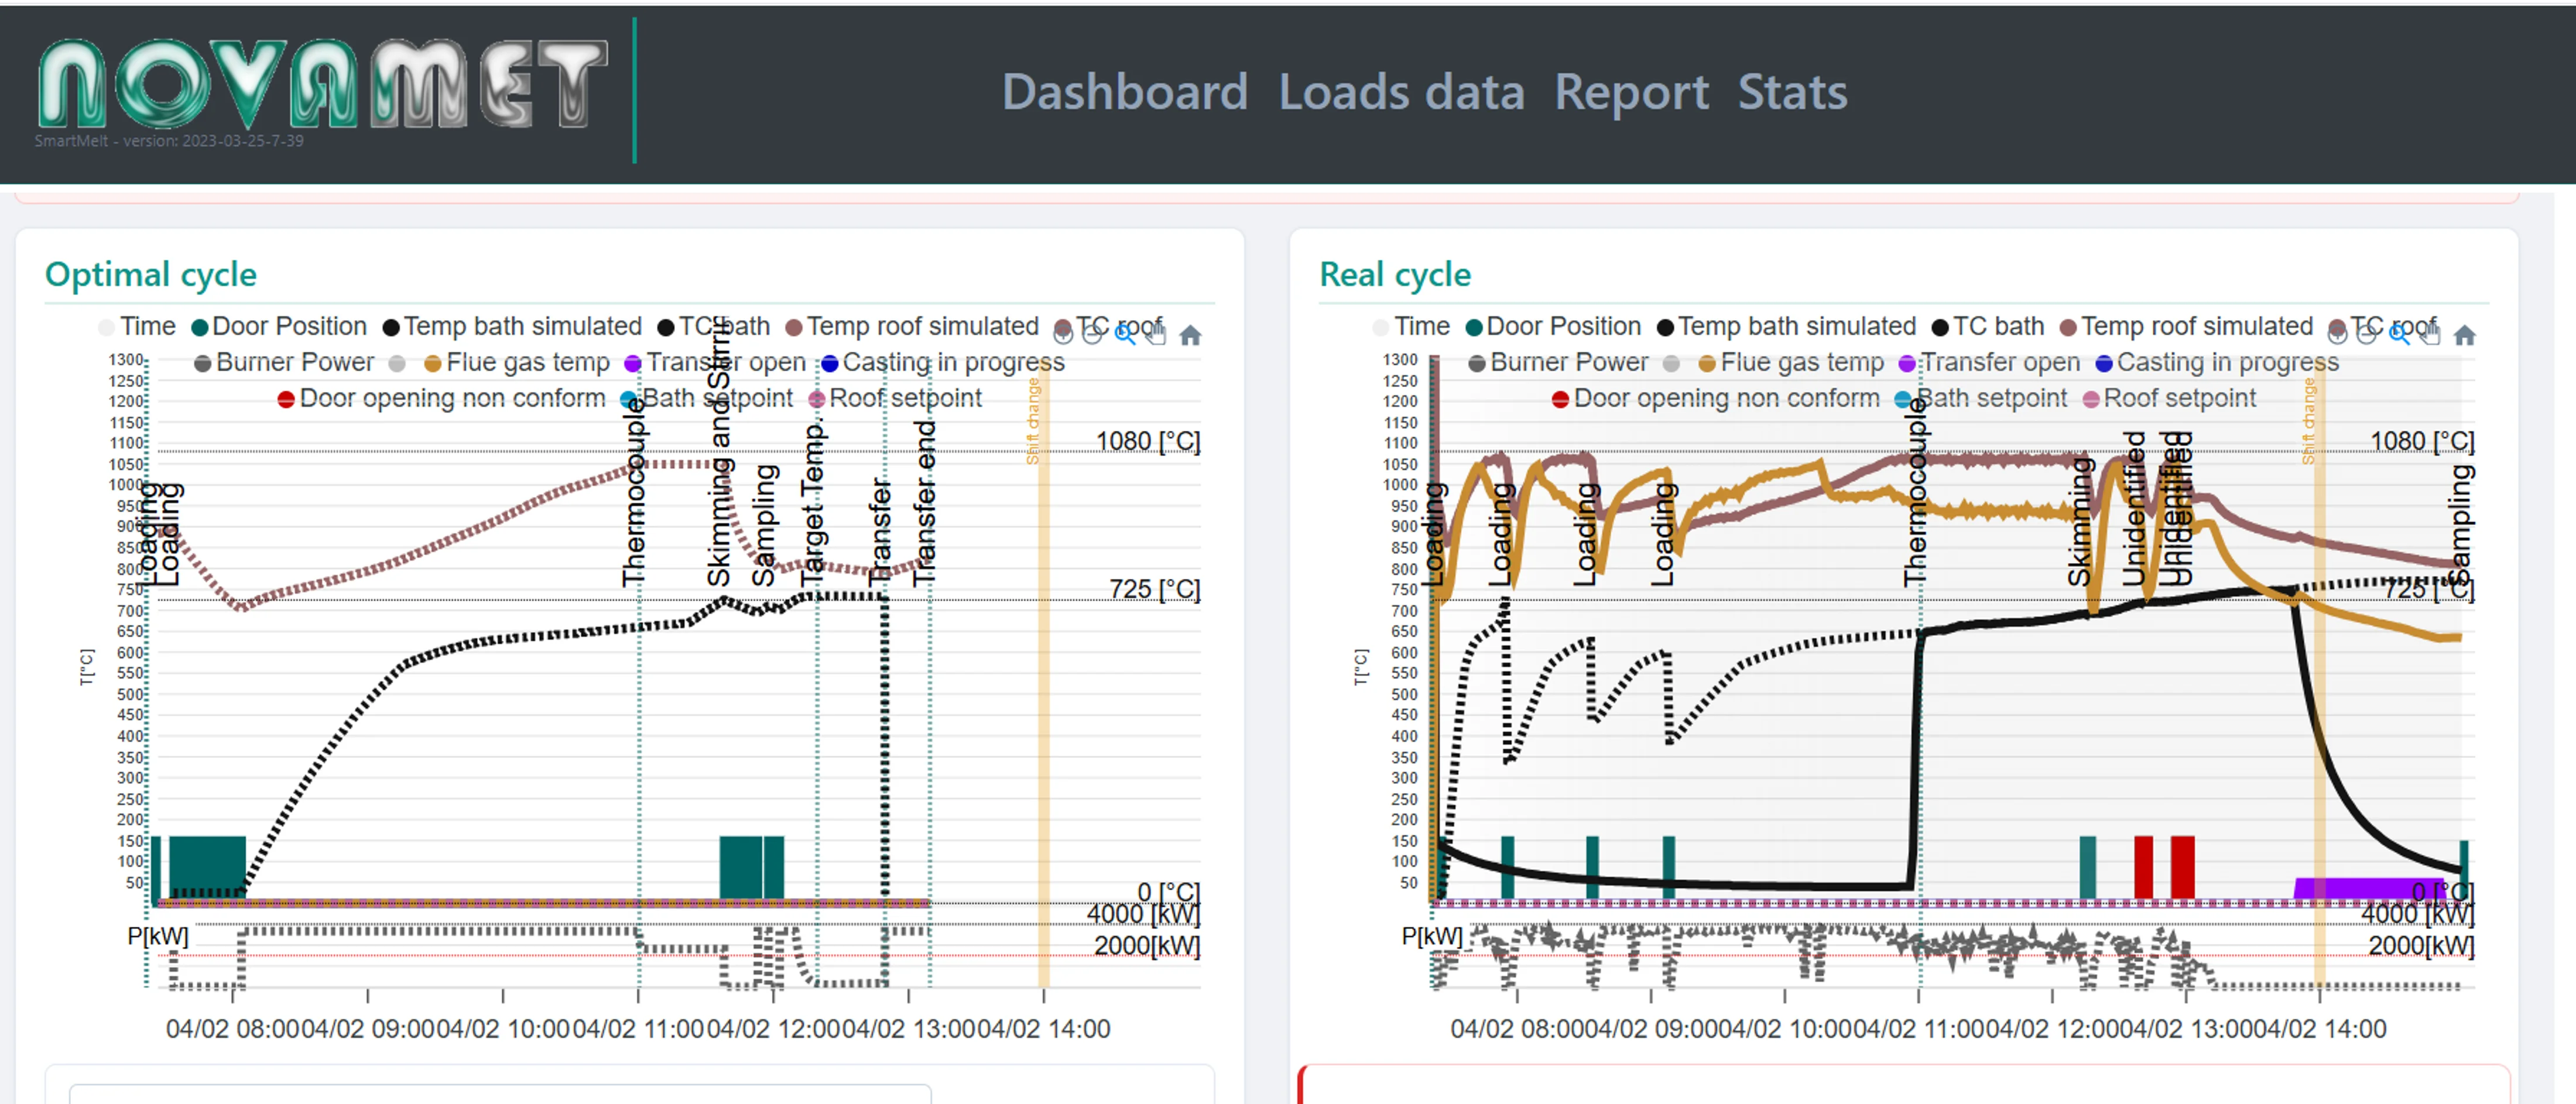
Optimal vs. Real Cycle Comparison
Side-by-side view of the digital twin simulation against actual furnace data — deviations are flagged with root causes.
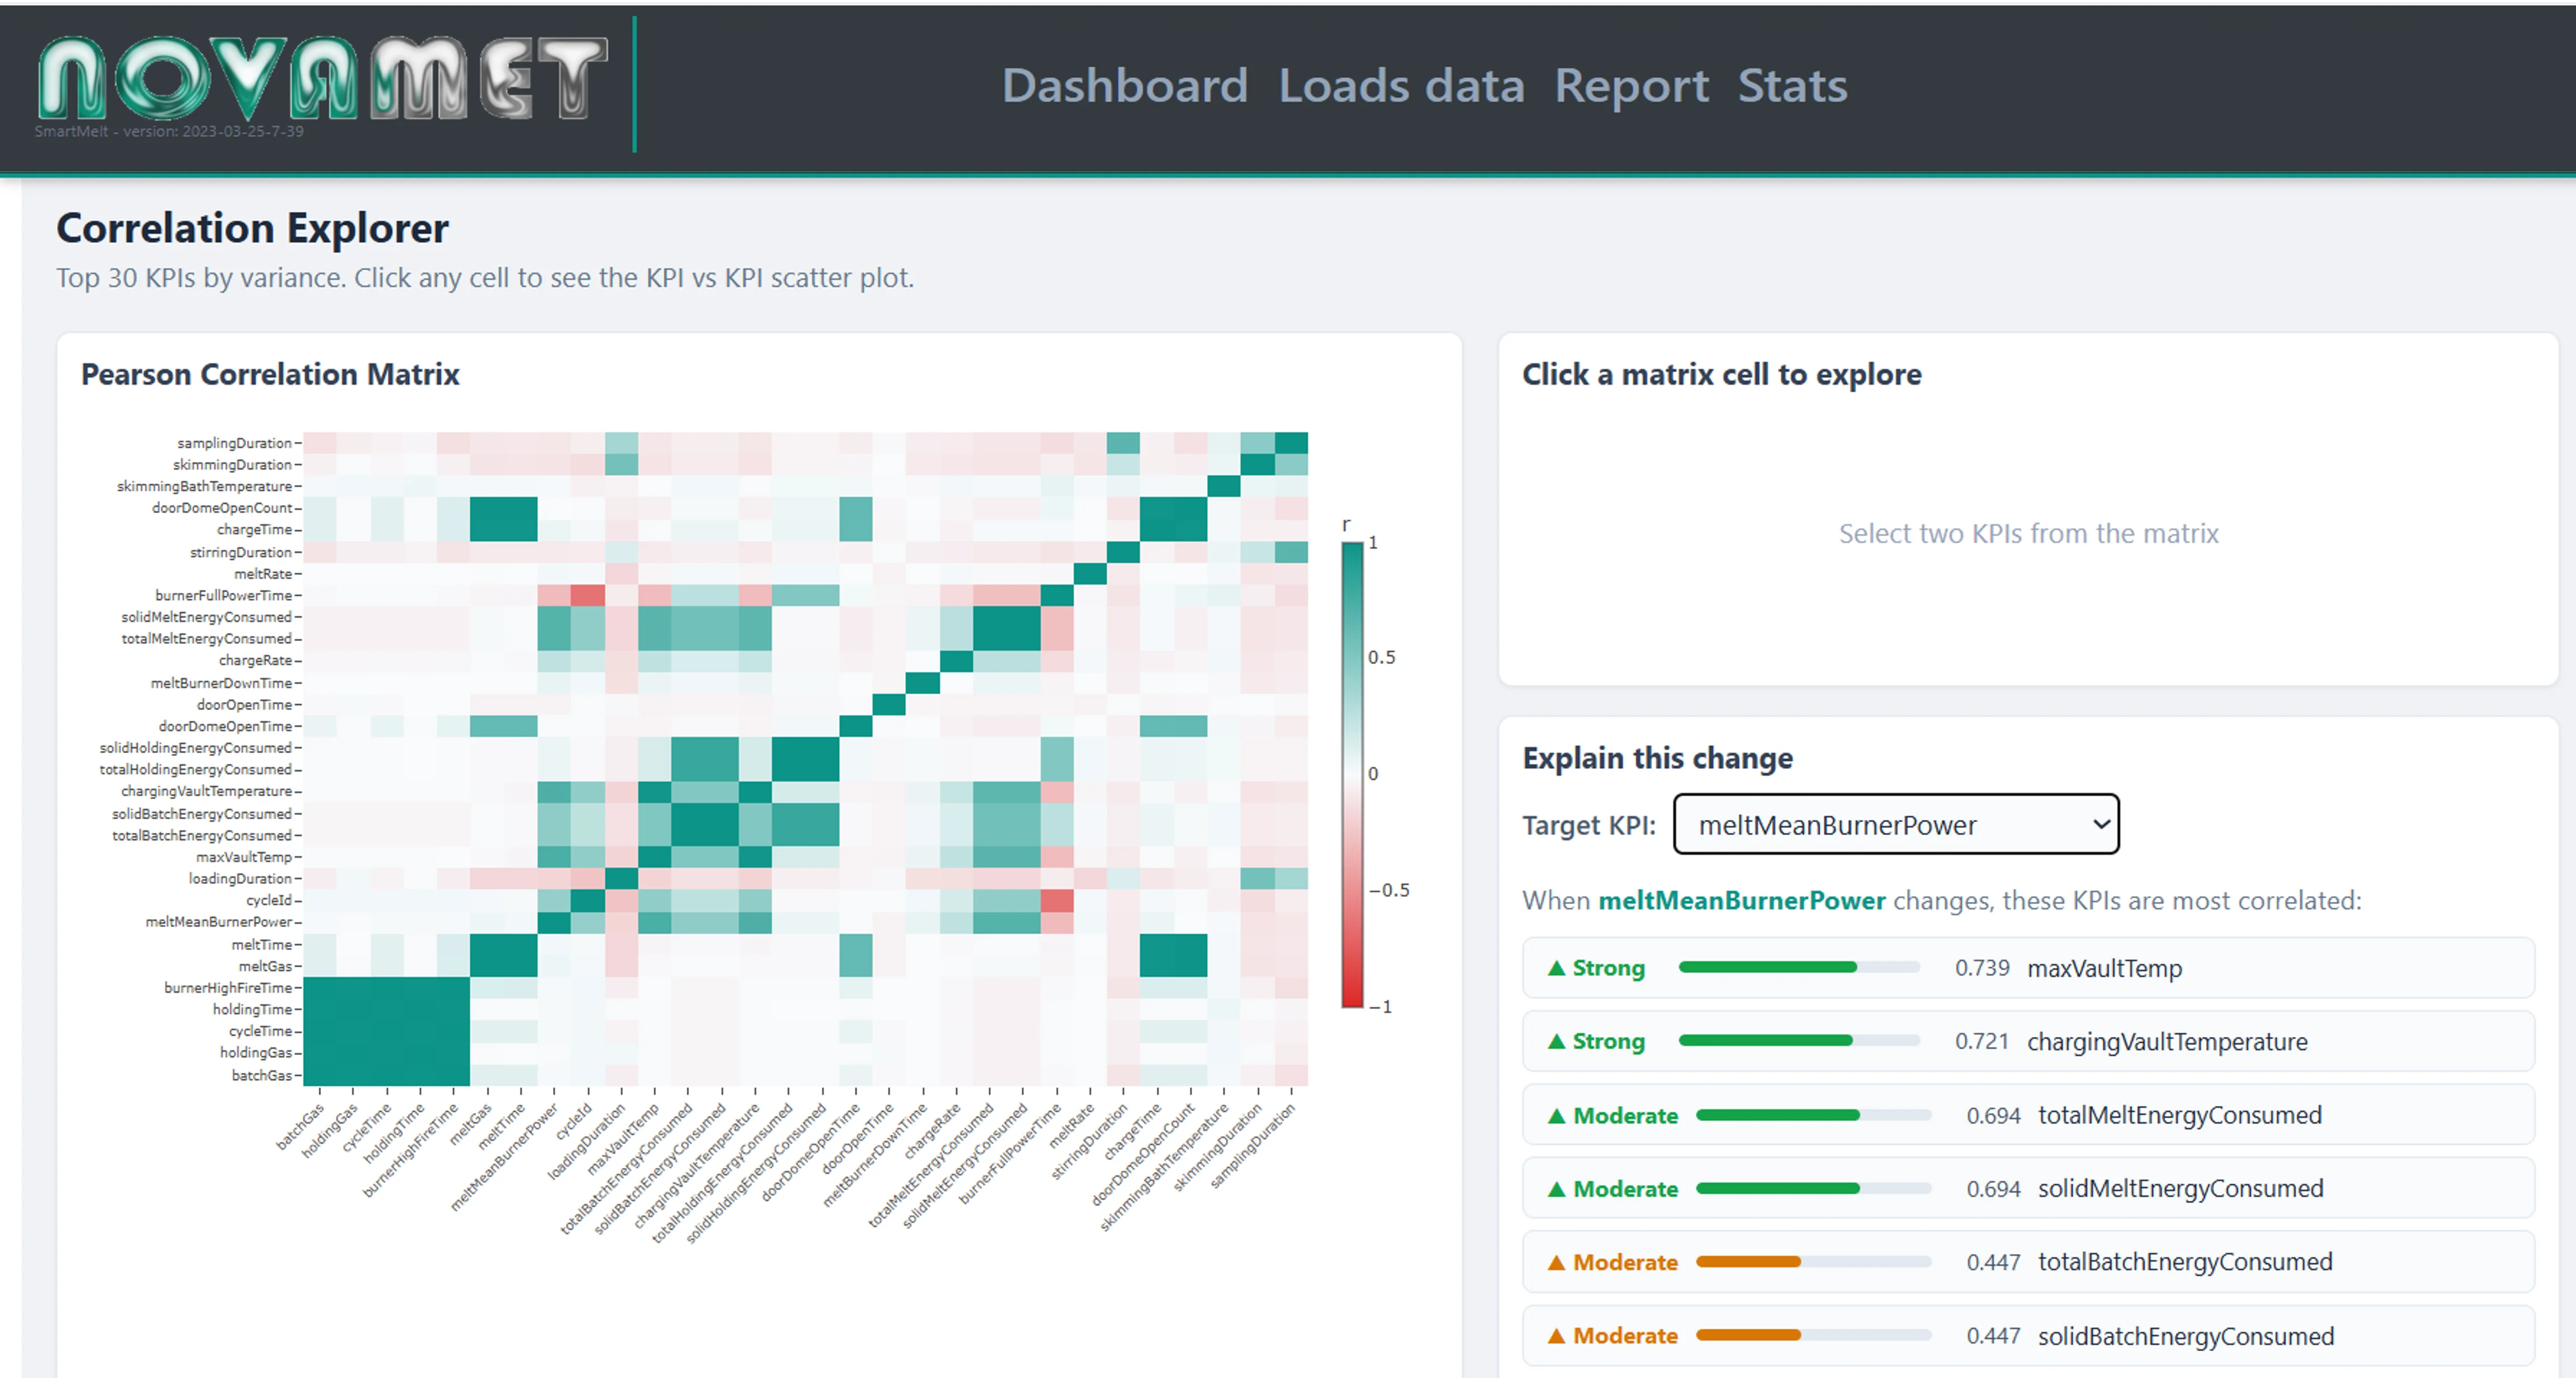
KPI Correlation Explorer
Pearson correlation matrix across 30+ process variables — click any cell to explore scatter plots and identify hidden relationships.
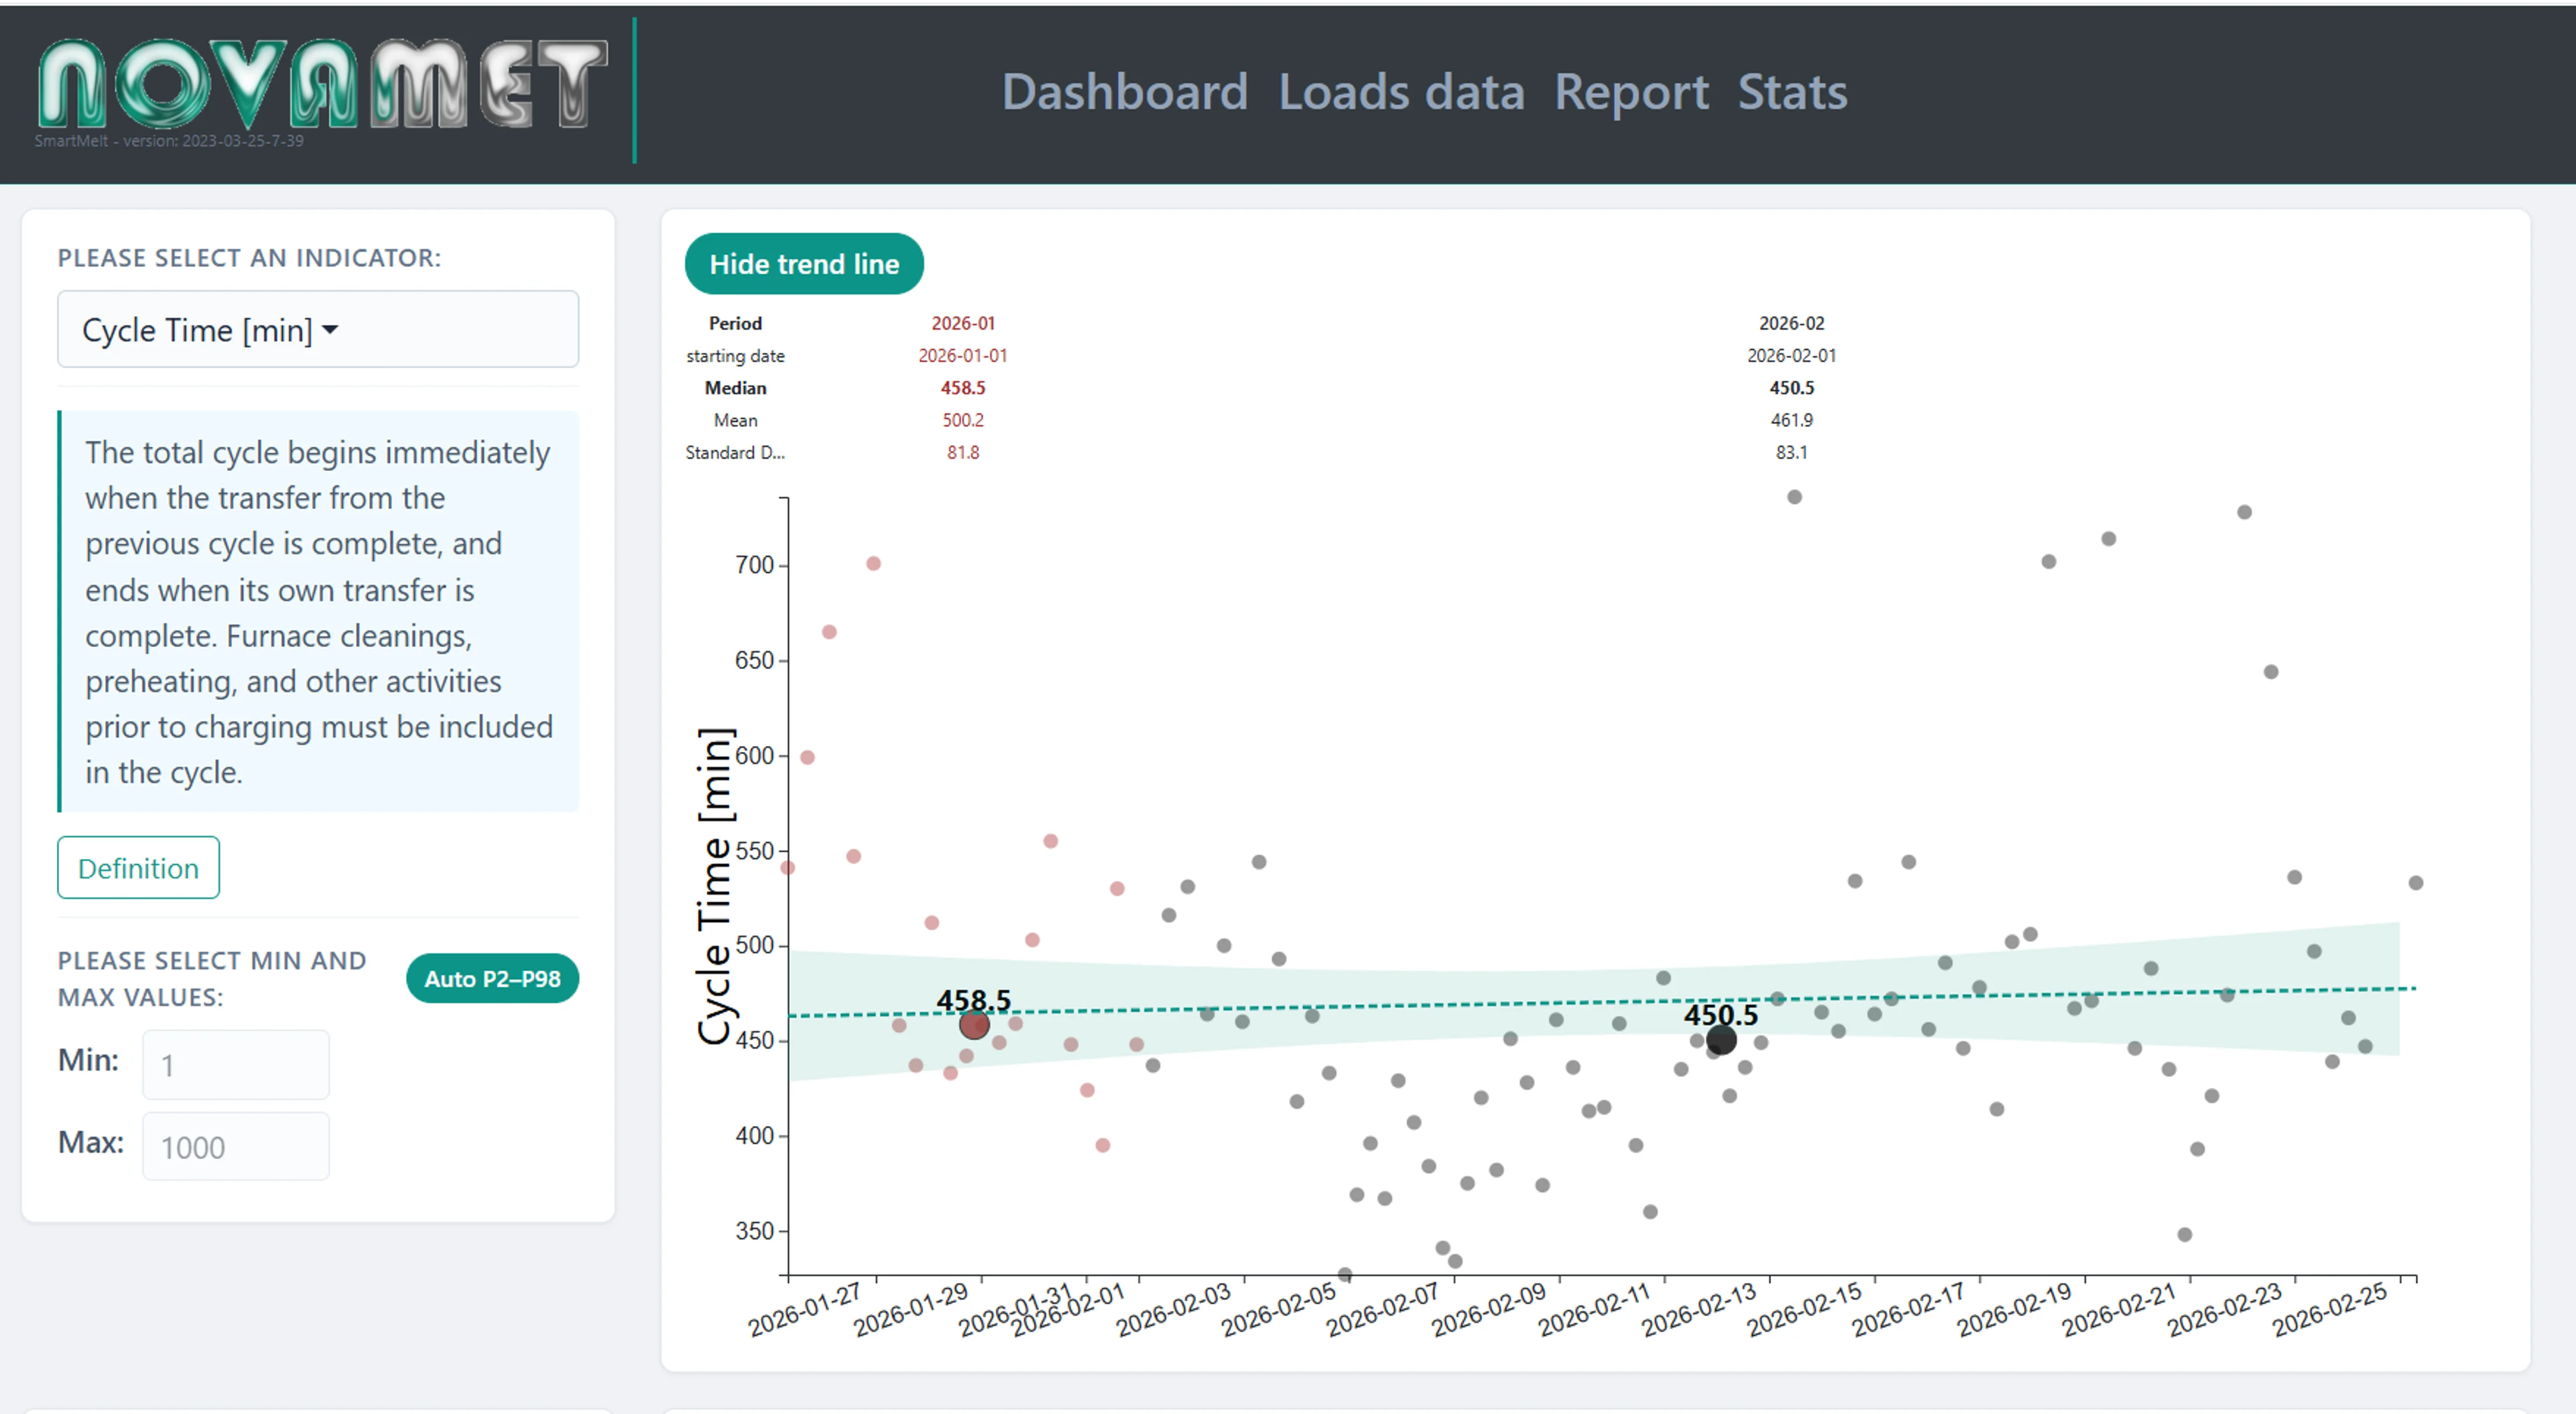
Cycle Time Trend Analysis
Track KPI trends with confidence bands — spot drift, measure improvement, and compare period-over-period performance.
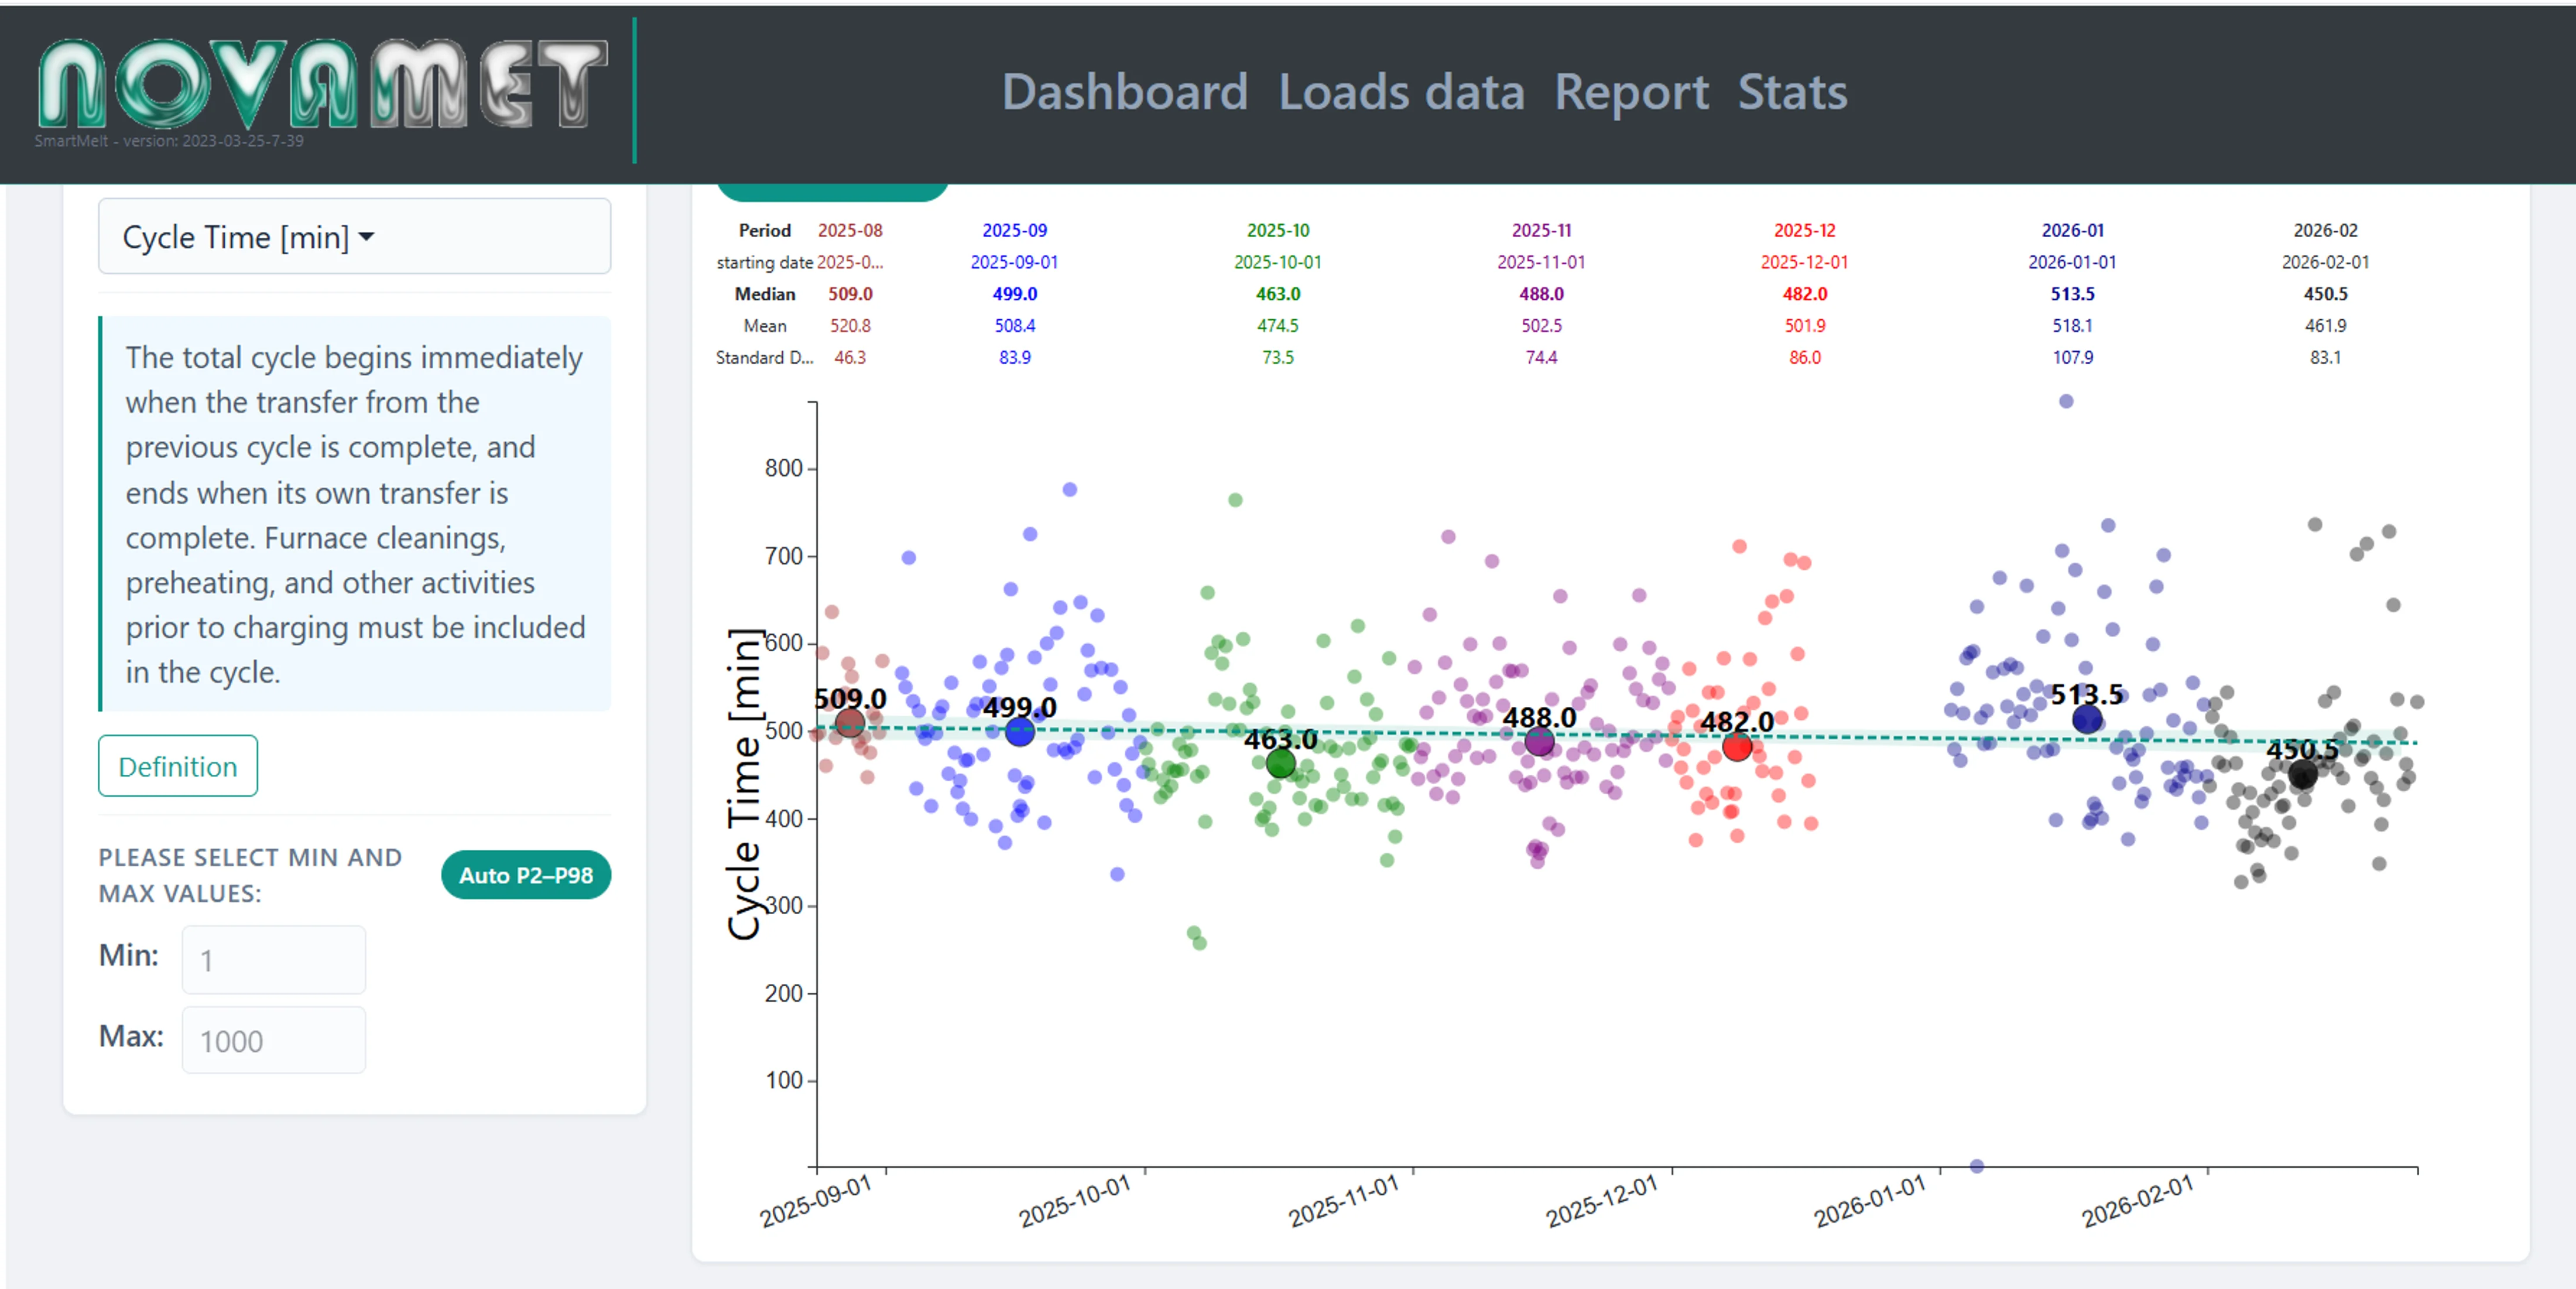
Multi-Period Performance
Color-coded monthly breakdown of cycle times with median tracking — visualize long-term optimization impact at a glance.
500,000+ Hours Proving It Works
Facilities across EU and US are already saving up to 0.5 M€ per furnace per year. First furnace installation takes 2 months. Operators need under 1 hour of training. Results show from the first cycle.